
Plant Intelligence Center
See how the whole planting scheme works through the year
Every plant in the open design, including hedges and planted areas, read together as one table and a set of charts. Use the whole drawing, or select plants on the canvas to look at part of it.
Analyse the garden as a whole
See how the whole planting scheme works through the year
Every view follows the project’s units: metres, square metres and °C, or feet, square feet and °F.
Plants in garden
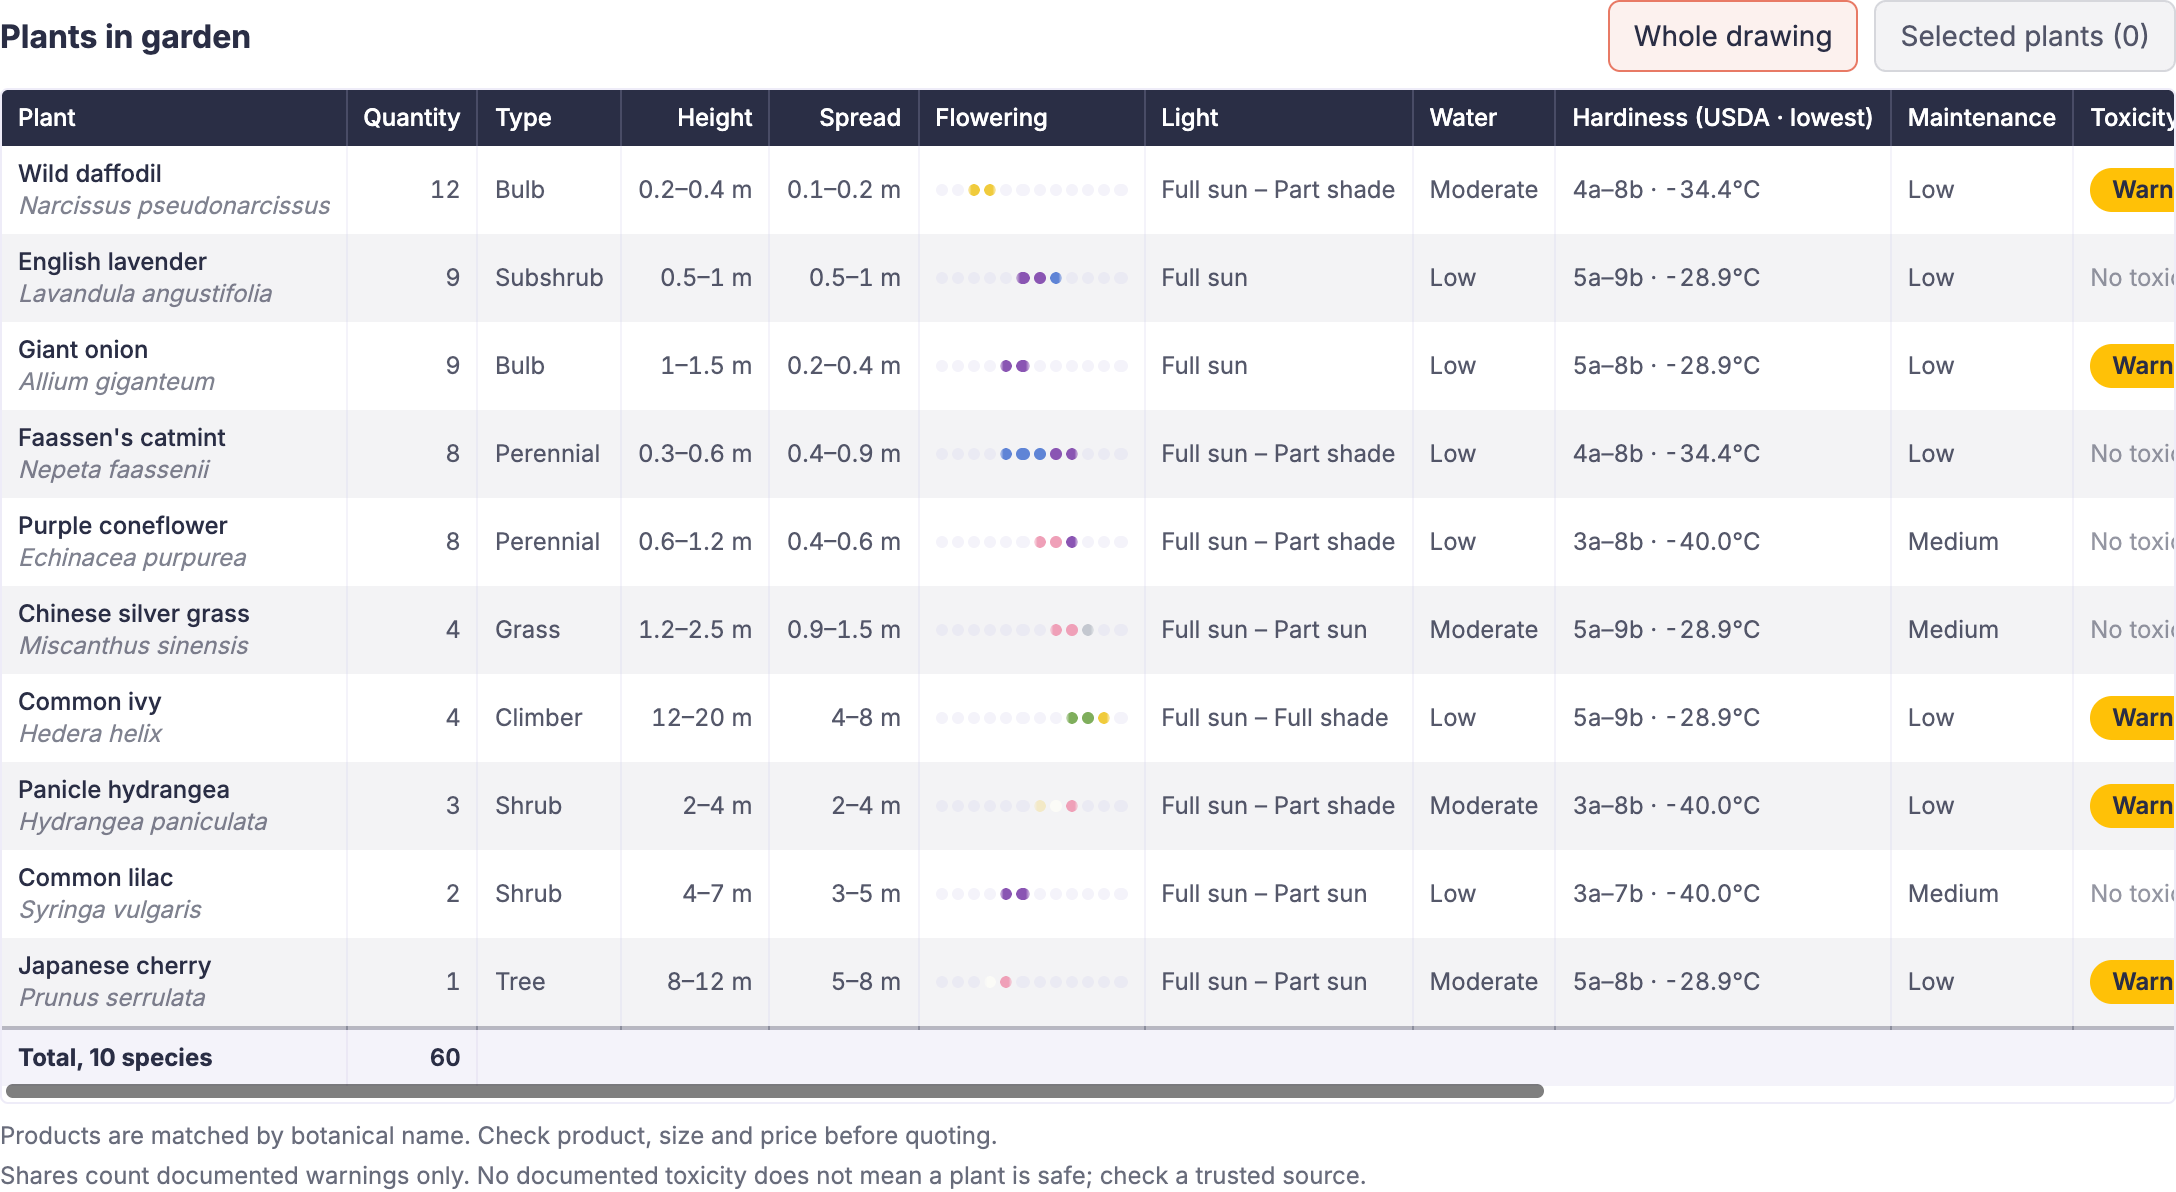
Every species in the design in one table, showing the matching product and price from your product catalog and price list. Nothing in your catalog, price list or cost estimate is changed.
Plants in garden
A sortable table of every species in the design, including hedges and planted areas: quantity, size, flowering, needs, hardiness, maintenance, toxicity warnings, and the product from your catalog with its unit price and total. Plants are matched to catalog products by botanical name. Select a row to open the plant.
Flowering and colour
Charts for the whole drawing, or only the plants you selected on the canvas.
Year of interest
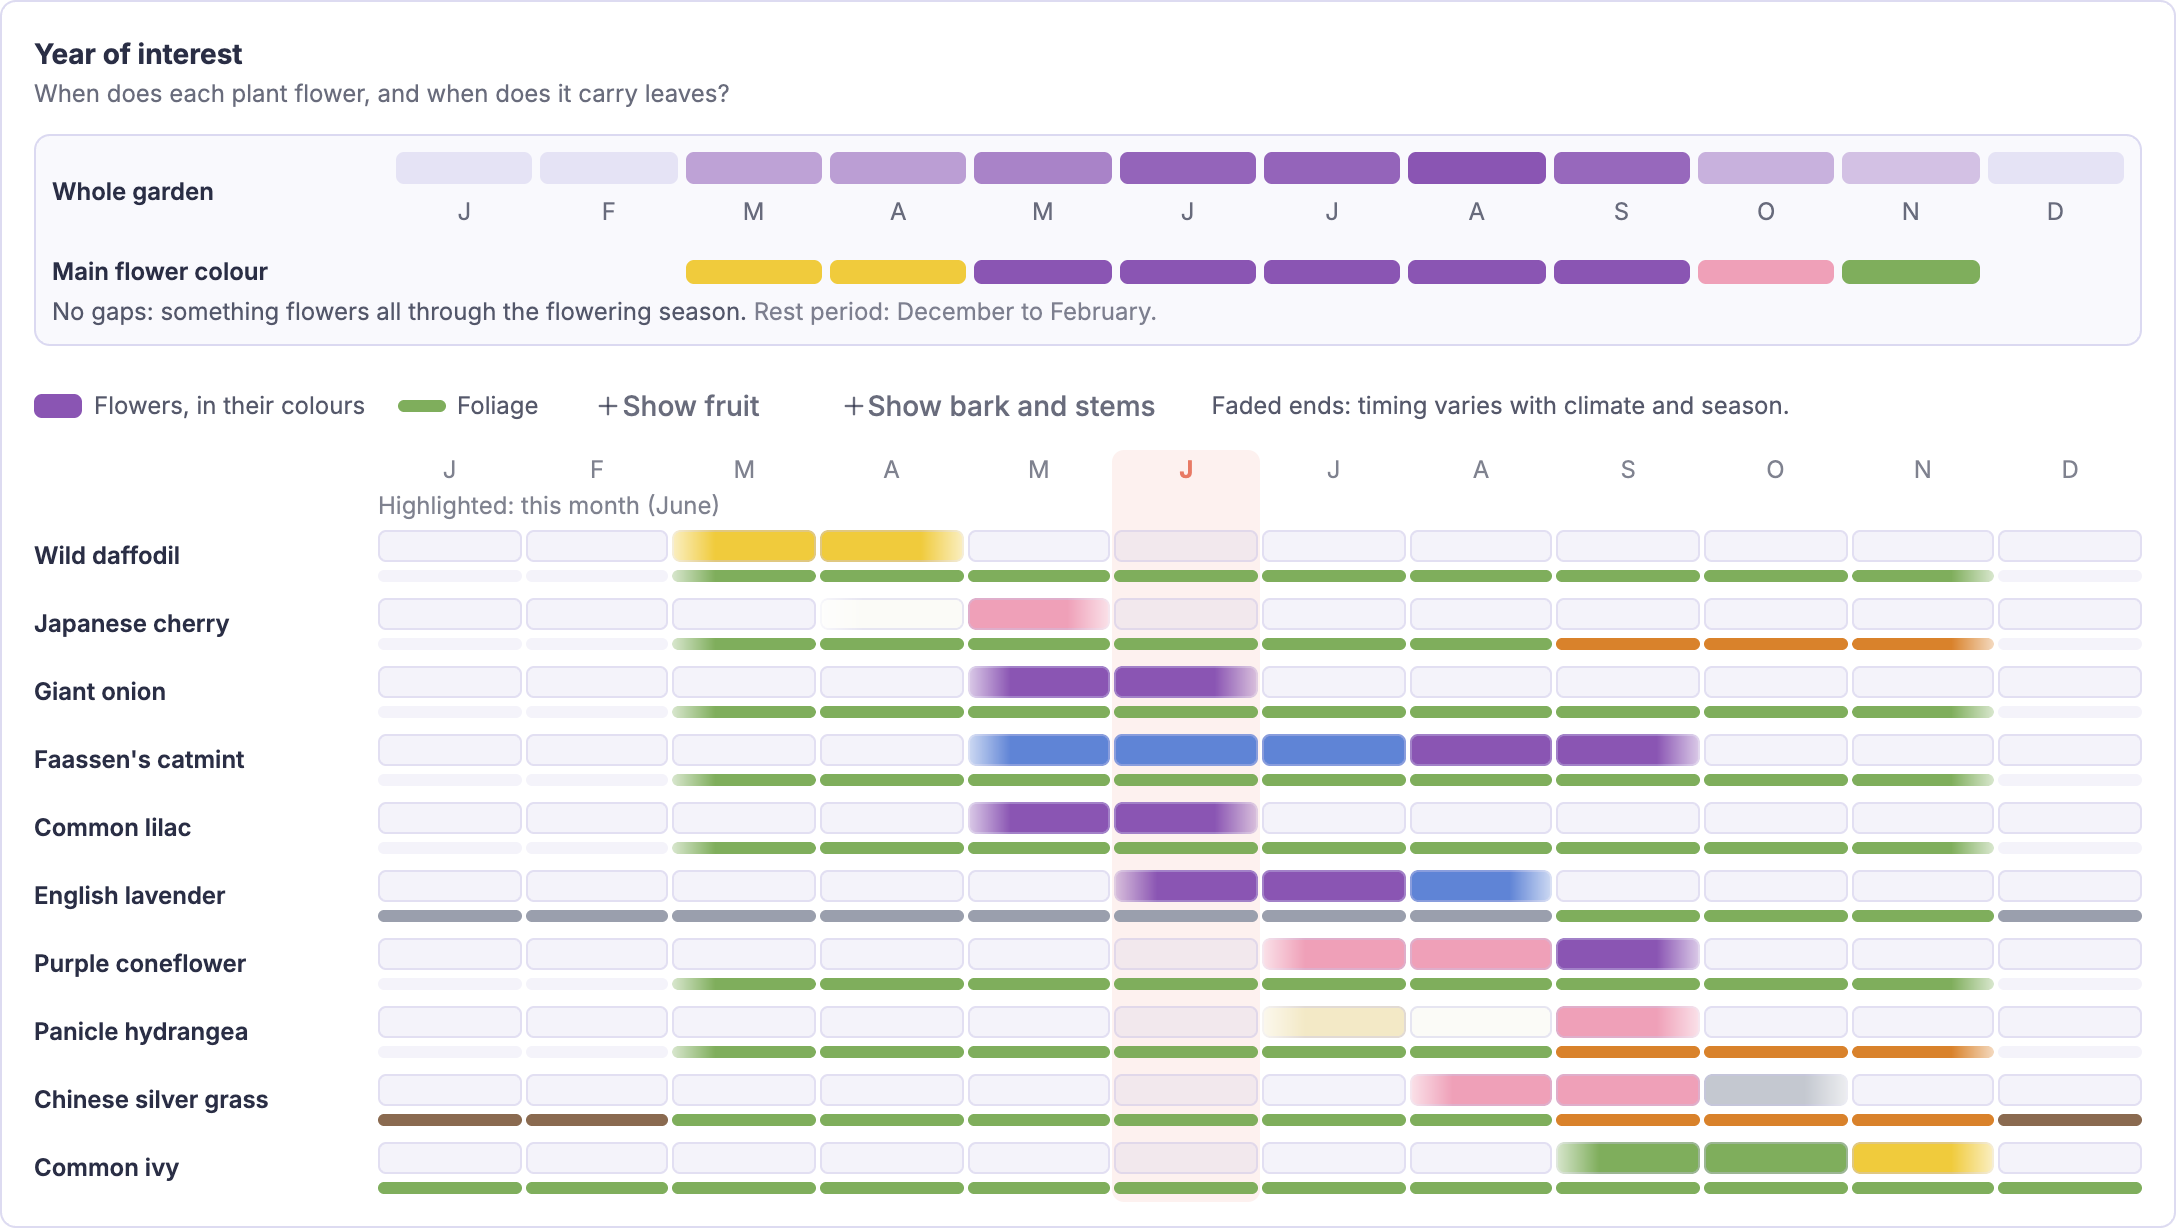
One row per plant showing flowering and foliage by month, the main flower colour of the whole garden and any flowering gaps.
Garden clock
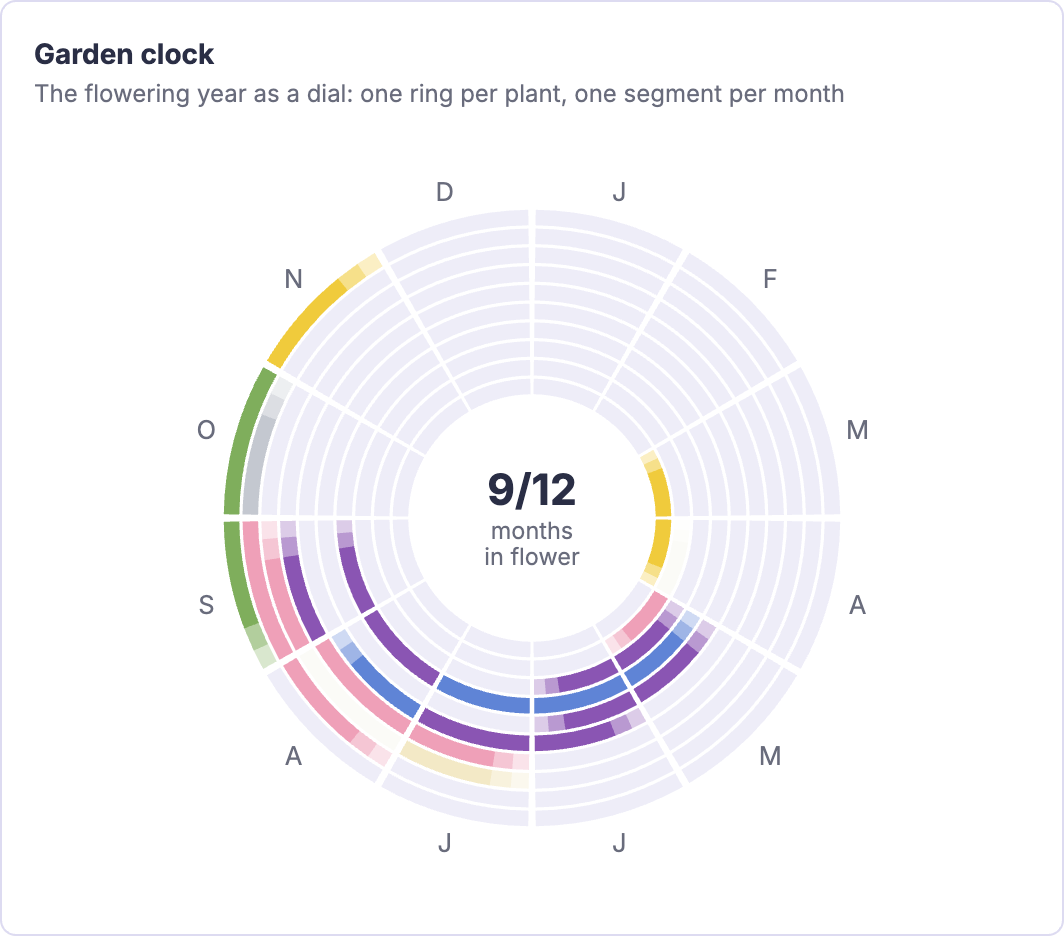
The flowering year as a dial: one ring per plant, one segment per month.
Colour mix by month
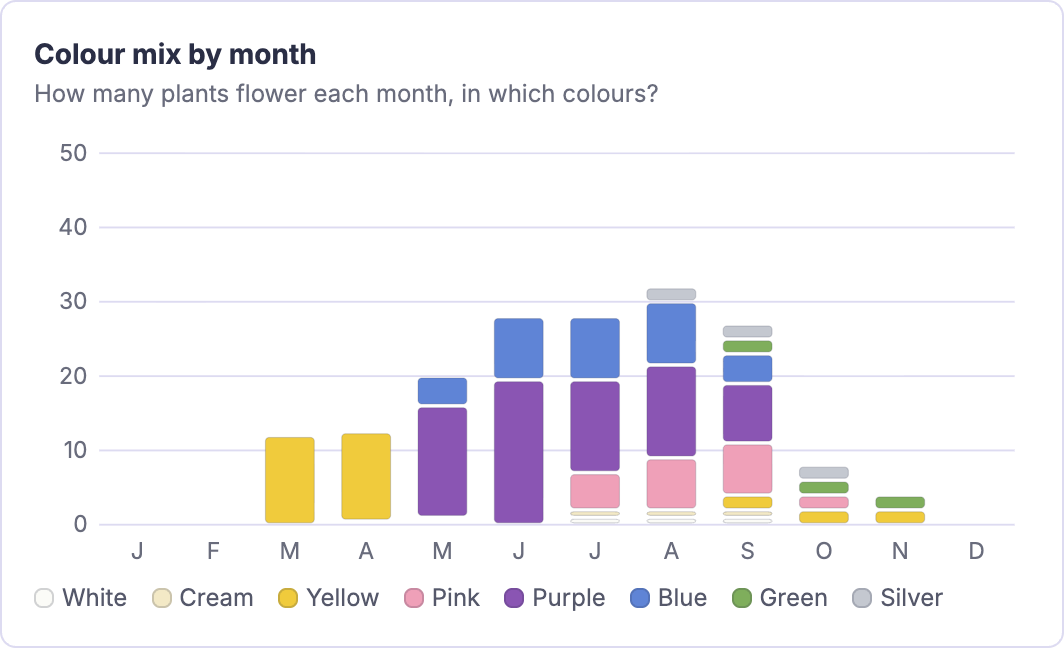
How many plants flower each month, and in which colours.
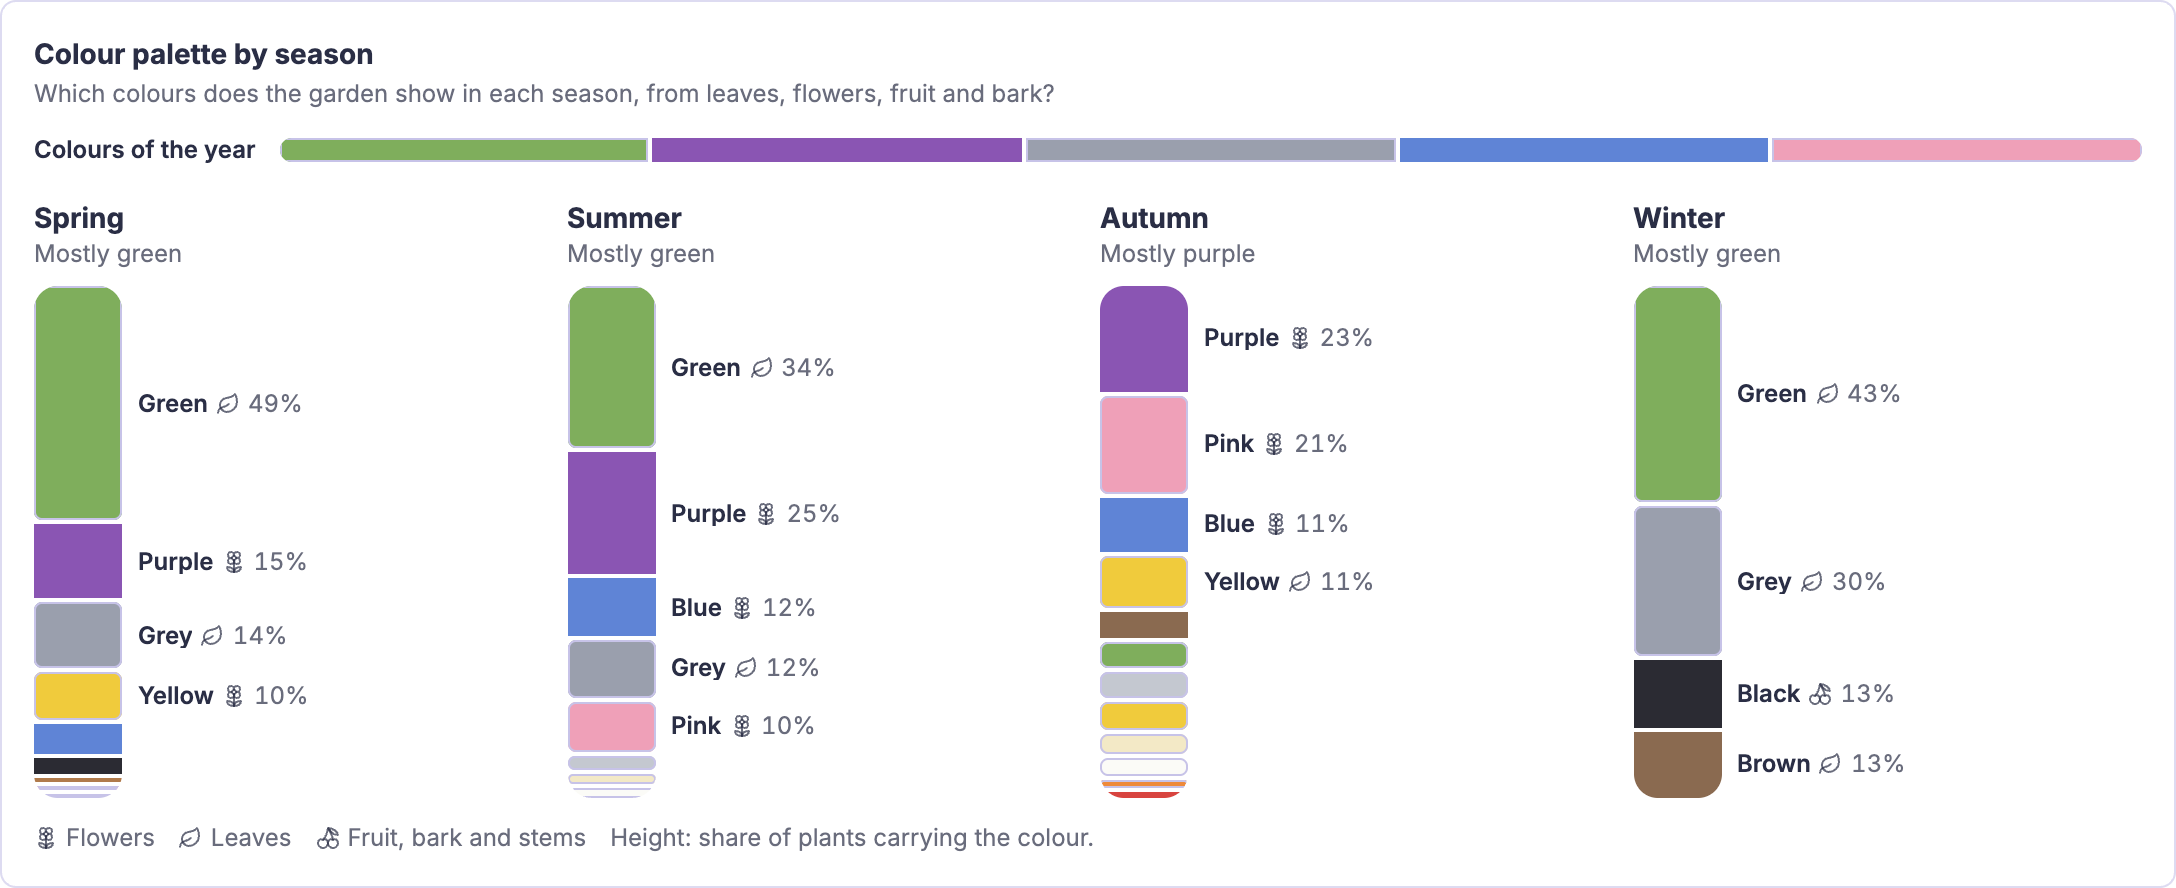
Colour palette by season
The colours of flowers, leaves, fruit and bark in each season, sized by how many plants carry them.
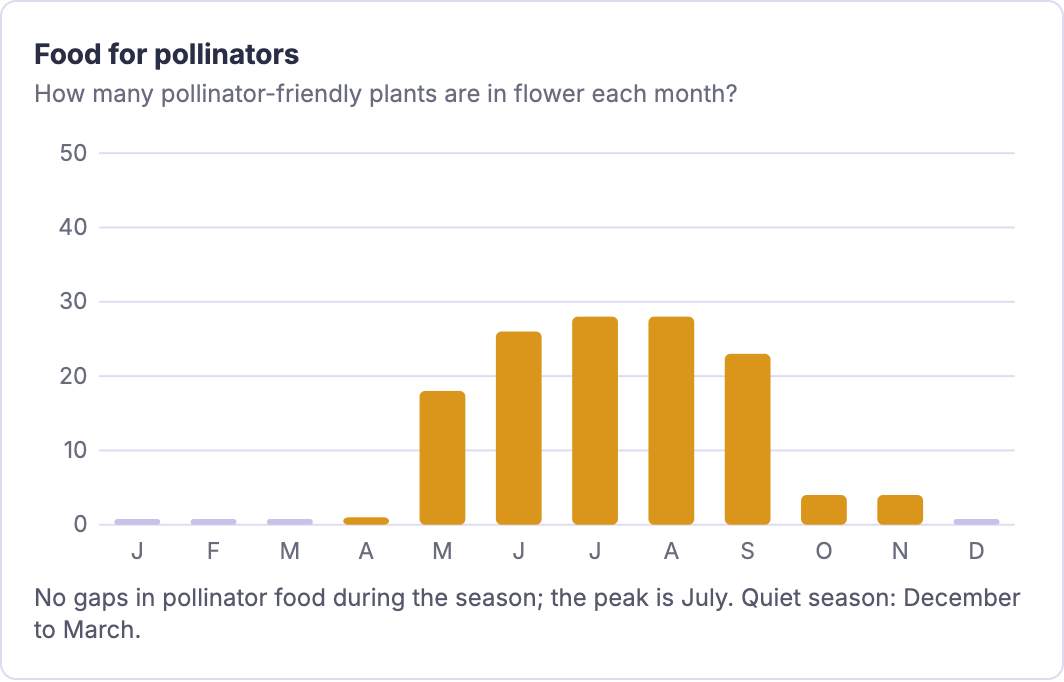
Food for pollinators
How many pollinator-friendly plants are in flower each month, with gaps called out.
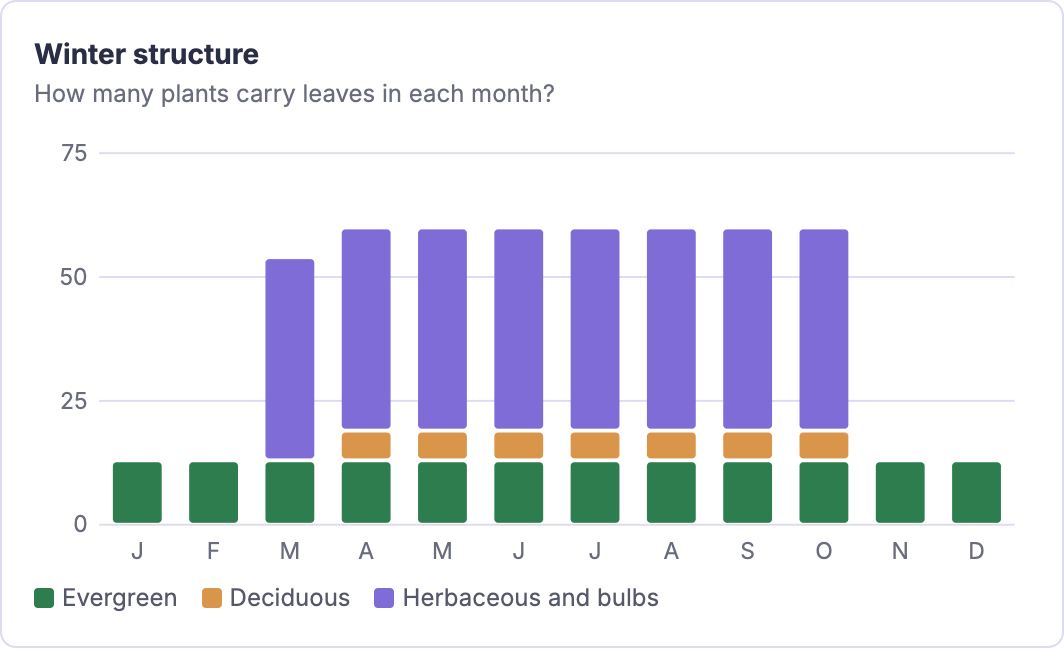
Winter structure
How many plants carry leaves each month, split into evergreen, deciduous and herbaceous plants and bulbs.
From the whole garden to one part of it
Every chart reads the whole drawing, or only the plants you selected on the canvas. Choose a plant group to look at trees and shrubs, perennials and bulbs, grasses and ferns, or climbers on their own. In large gardens, charts that draw one row or ring per species show the twelve most planted species, and lists can be expanded to show them all.

Plant groups
The plant group chips and the summary tiles with Trees and shrubs chosen: the summary now counts only those plants.
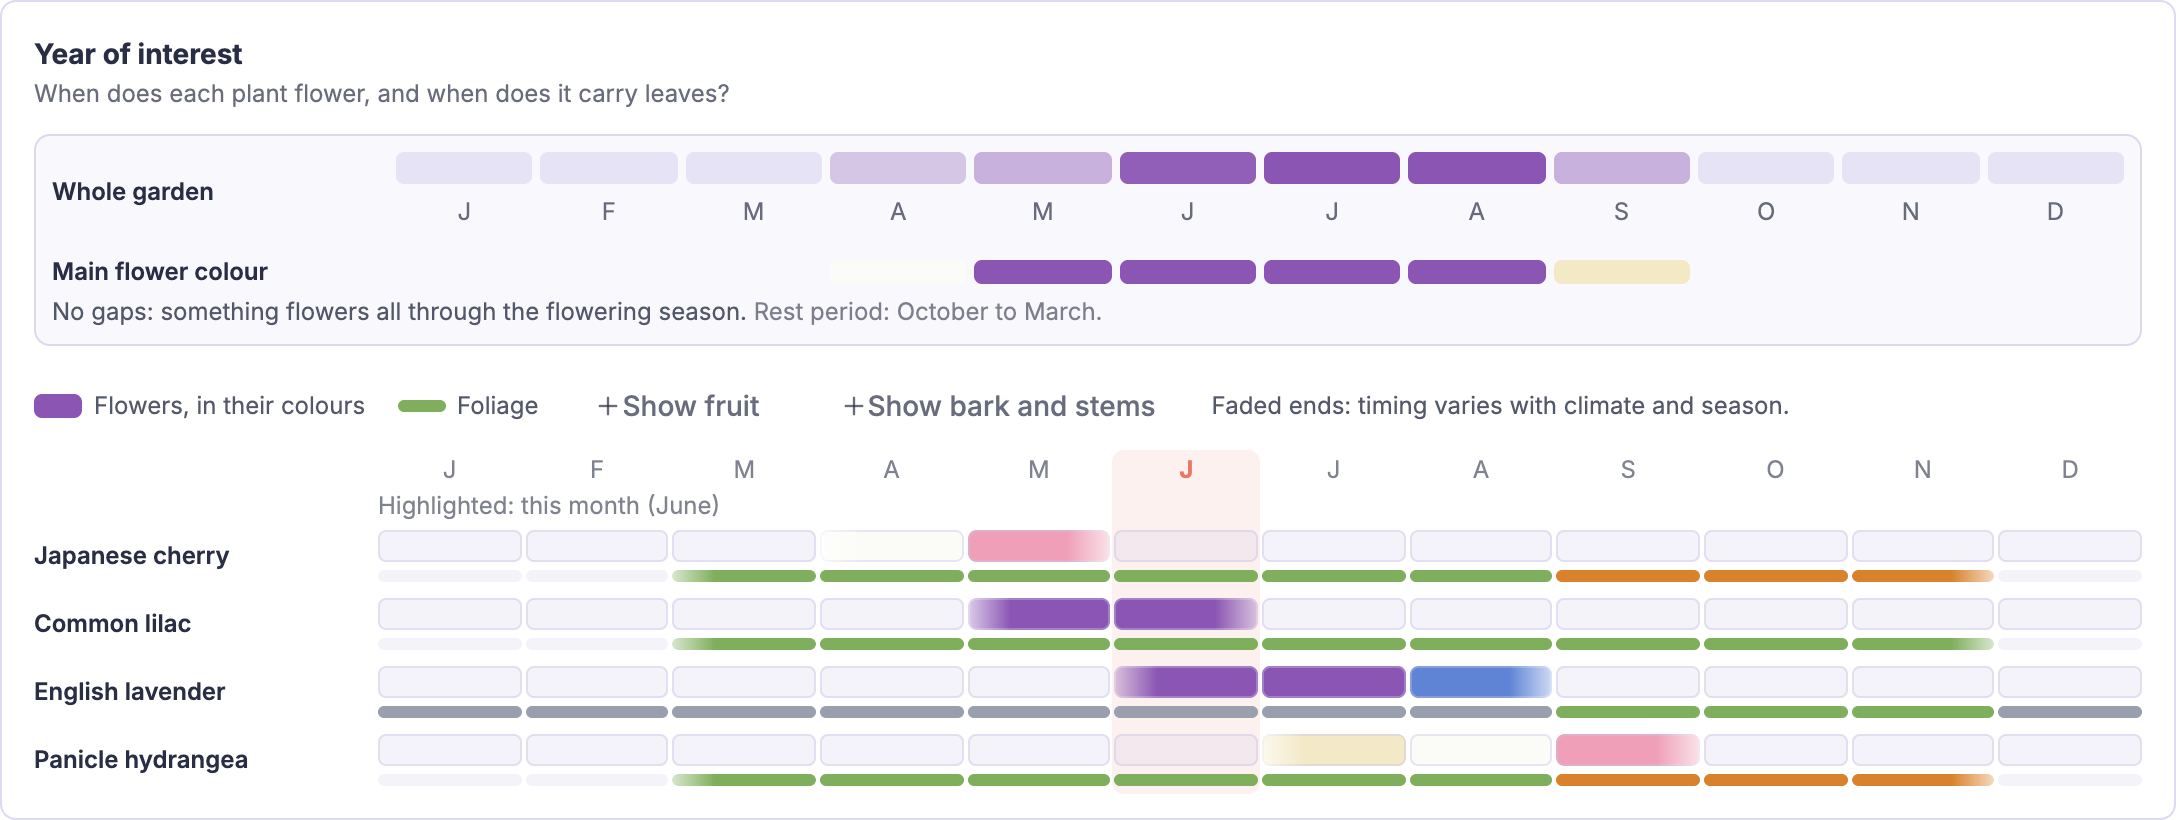
Year of interest for one group
The same Year of interest chart, showing only the trees and shrubs.
Structure, site and safety
How tall the planting grows, what it needs from the site and how well it copes.
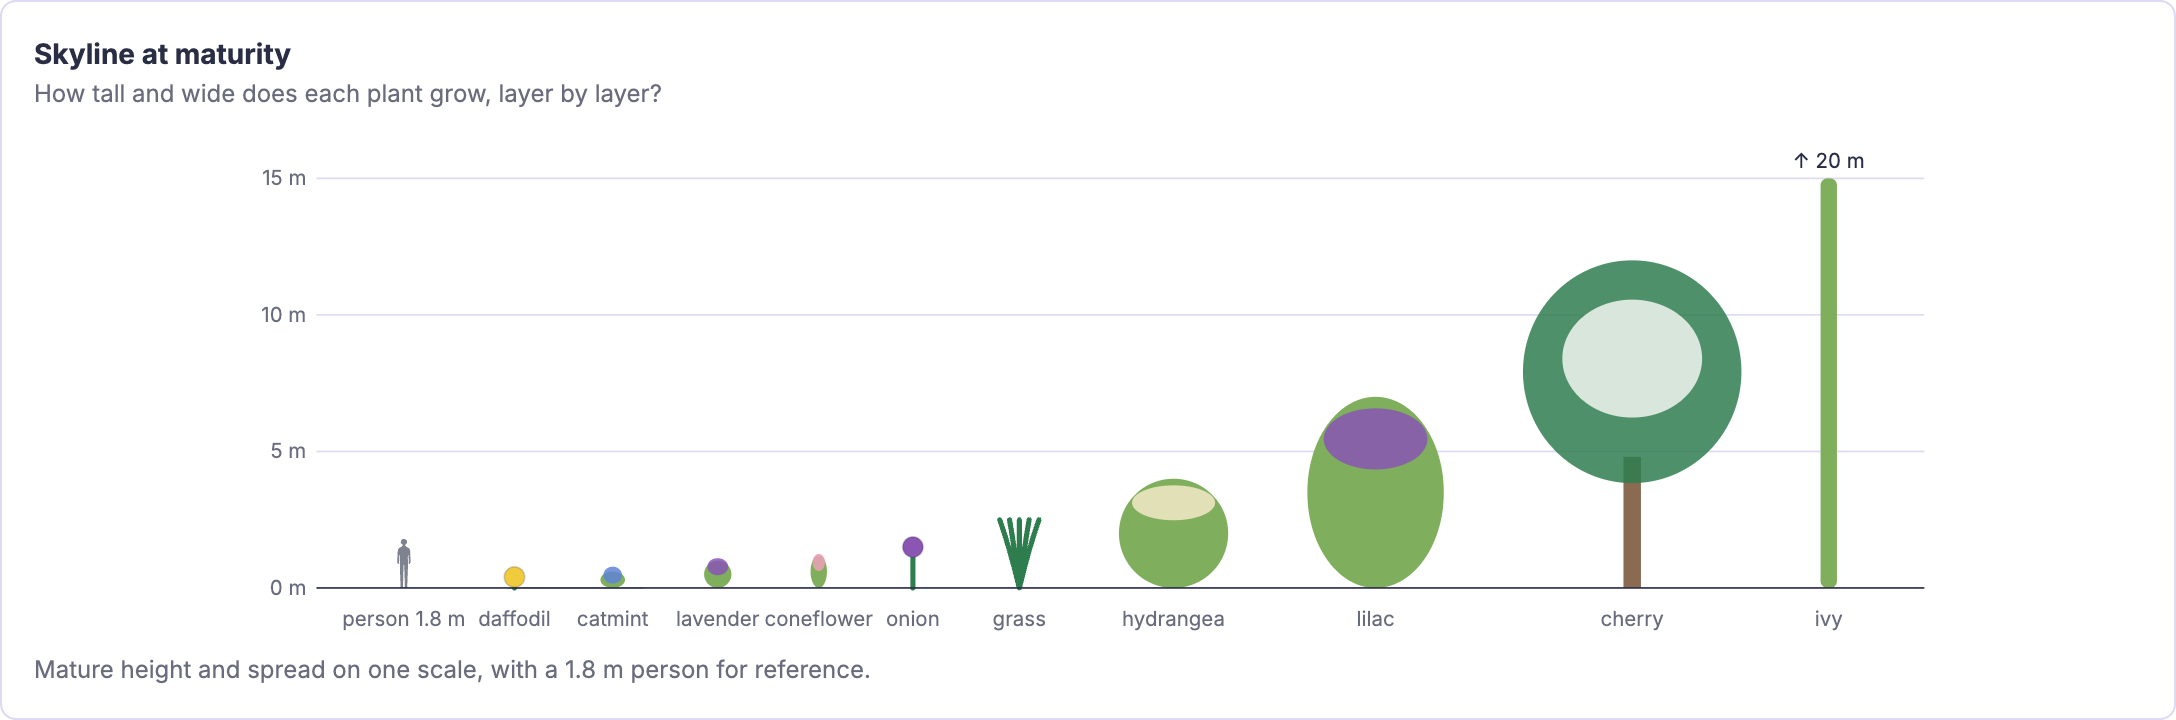
Skyline at maturity
Every plant at its mature height and spread on one scale, with a person for reference.
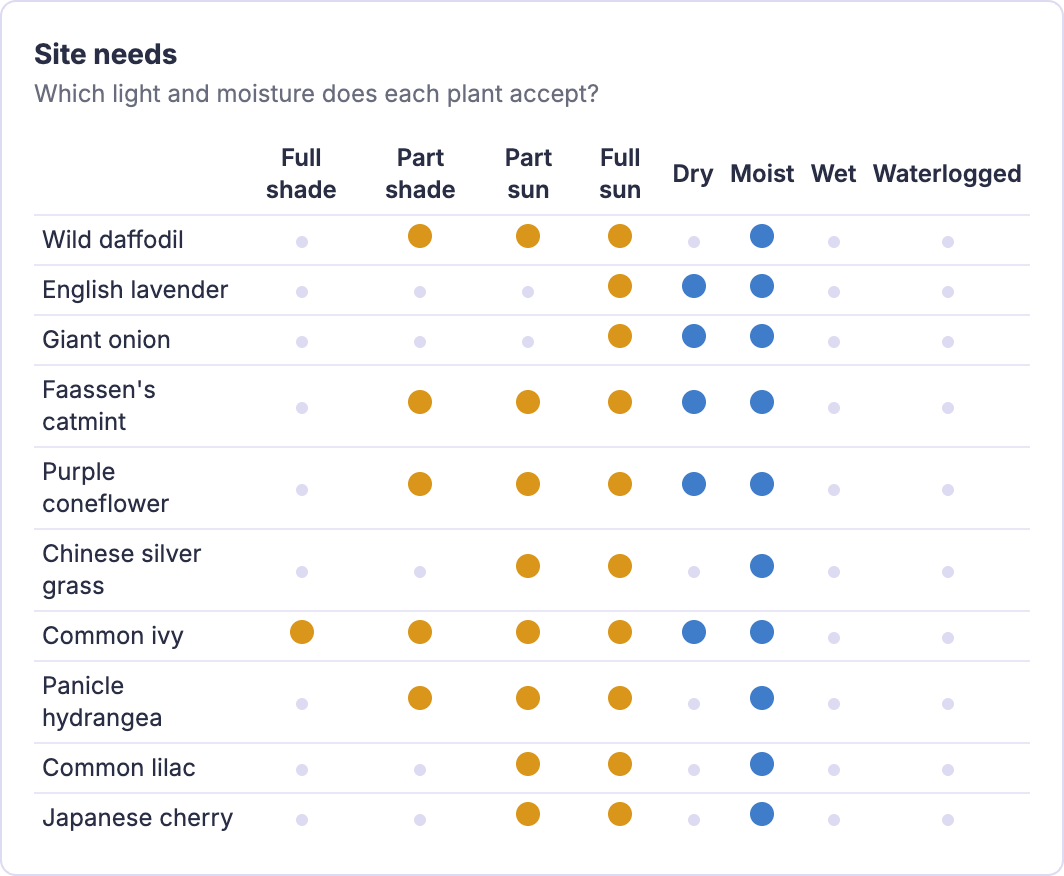
Site needs
The light and moisture each plant accepts, so plants with different needs stand out.
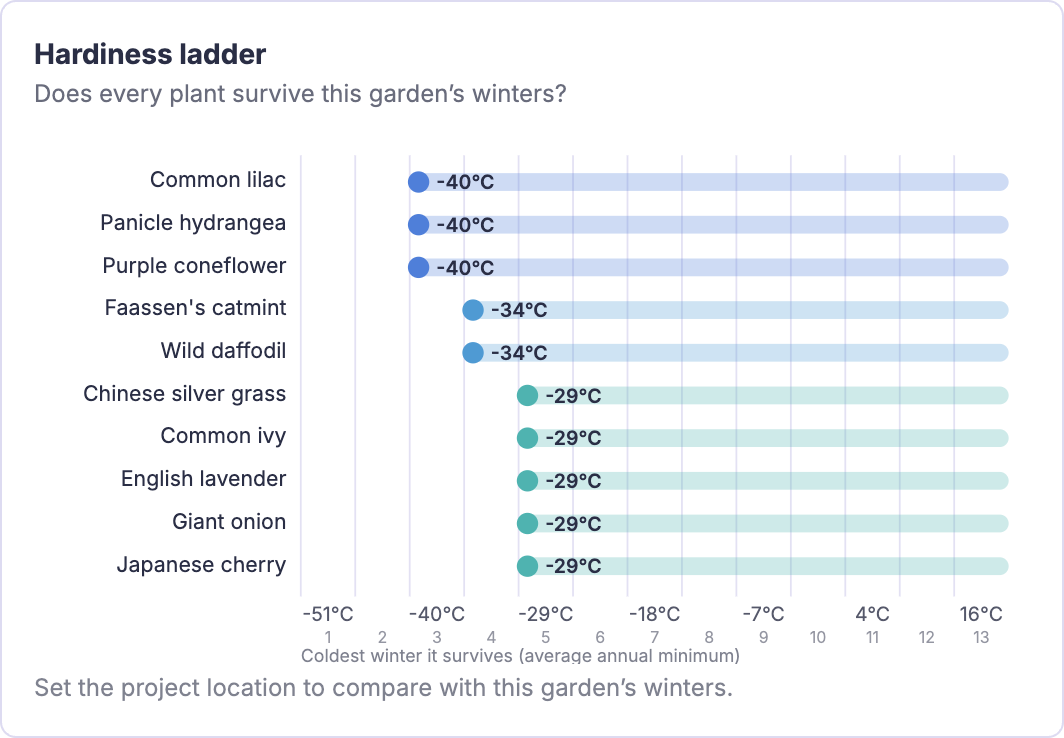
Hardiness ladder
Each plant’s hardiness zone range on one scale.
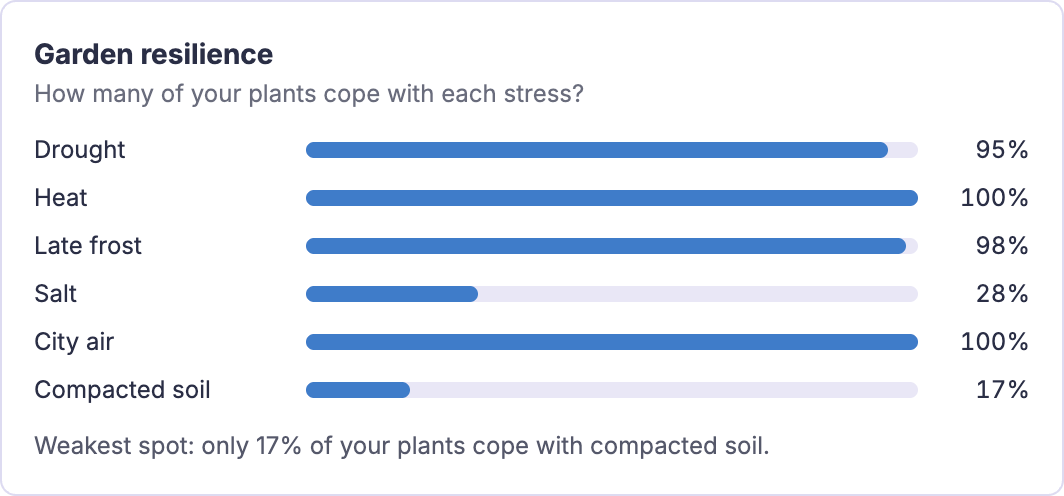
Garden resilience
The share of plants that cope with each stress, and the weakest spot.
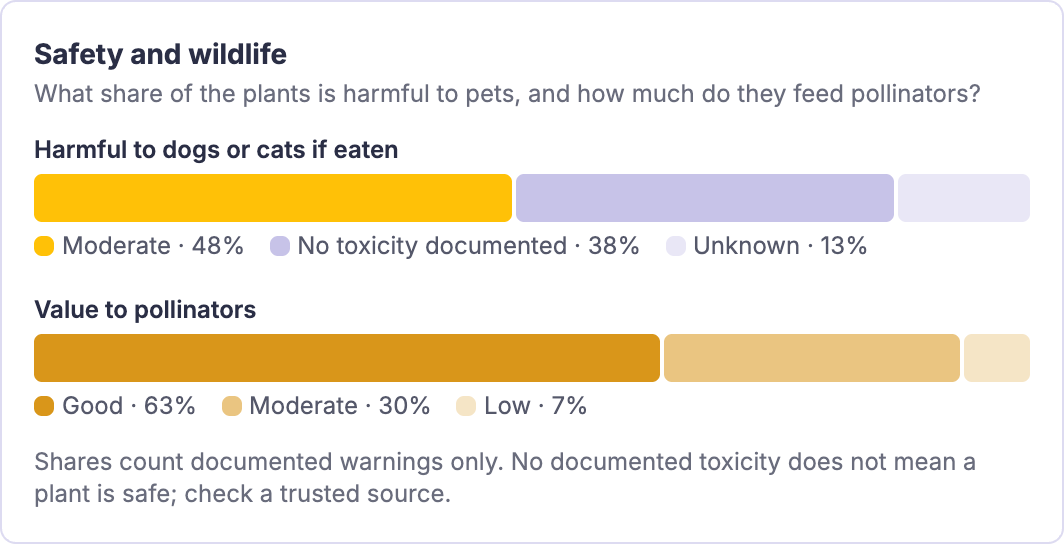
Safety and wildlife
The share of plants with documented toxicity for dogs or cats, beside their value to pollinators.
In the client’s plant list document
The plant list document can include the garden charts on this page as print graphics: palette board, year of colour, skyline, garden clock, winter structure, site needs, hardiness ladder and resilience. It adds one view that only exists in print, the seasonal interest matrix.
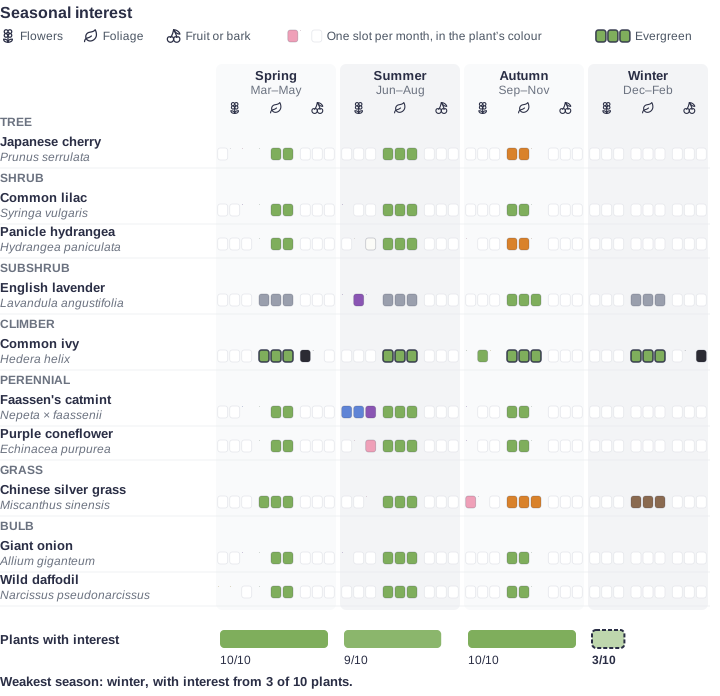
Seasonal interest matrix
Every plant against every season, grouped by plant type, with the weakest season named.
Useful to know
Plant information is AI-generated and labelled as such in the product. Use it as a design reference and confirm important decisions, such as toxicity or suitability for a particular site, with a trusted source. Choose Insert into drawing on a plant page to start placing it with the planting tools. Hedges and planted areas are made with their own wizards, and the Plant Intelligence Center reads every plant in the drawing. Plant illustrations and charts are schematic. Care time estimates cover plant care only: lawn mowing and other surface care are not included, and tasks stated per area are counted once per plant.